Compass is a meta visualization tool that combines the key benefits of visualization and business analytics engines, providing multi-platform application transparency, and automatic controlled publication of data to authorized users.
WHAT IS
COMPASS?
Compass is a meta visualization tool that combines the key benefits of visualization engines and business analytics engines, providing multi-platform application transparency, and automatic controlled publication of data to authorized users.
Compass has been successfully used by government and private enterprise clients to maintain and publish complex data, and quickly build visualization systems for broad publication.
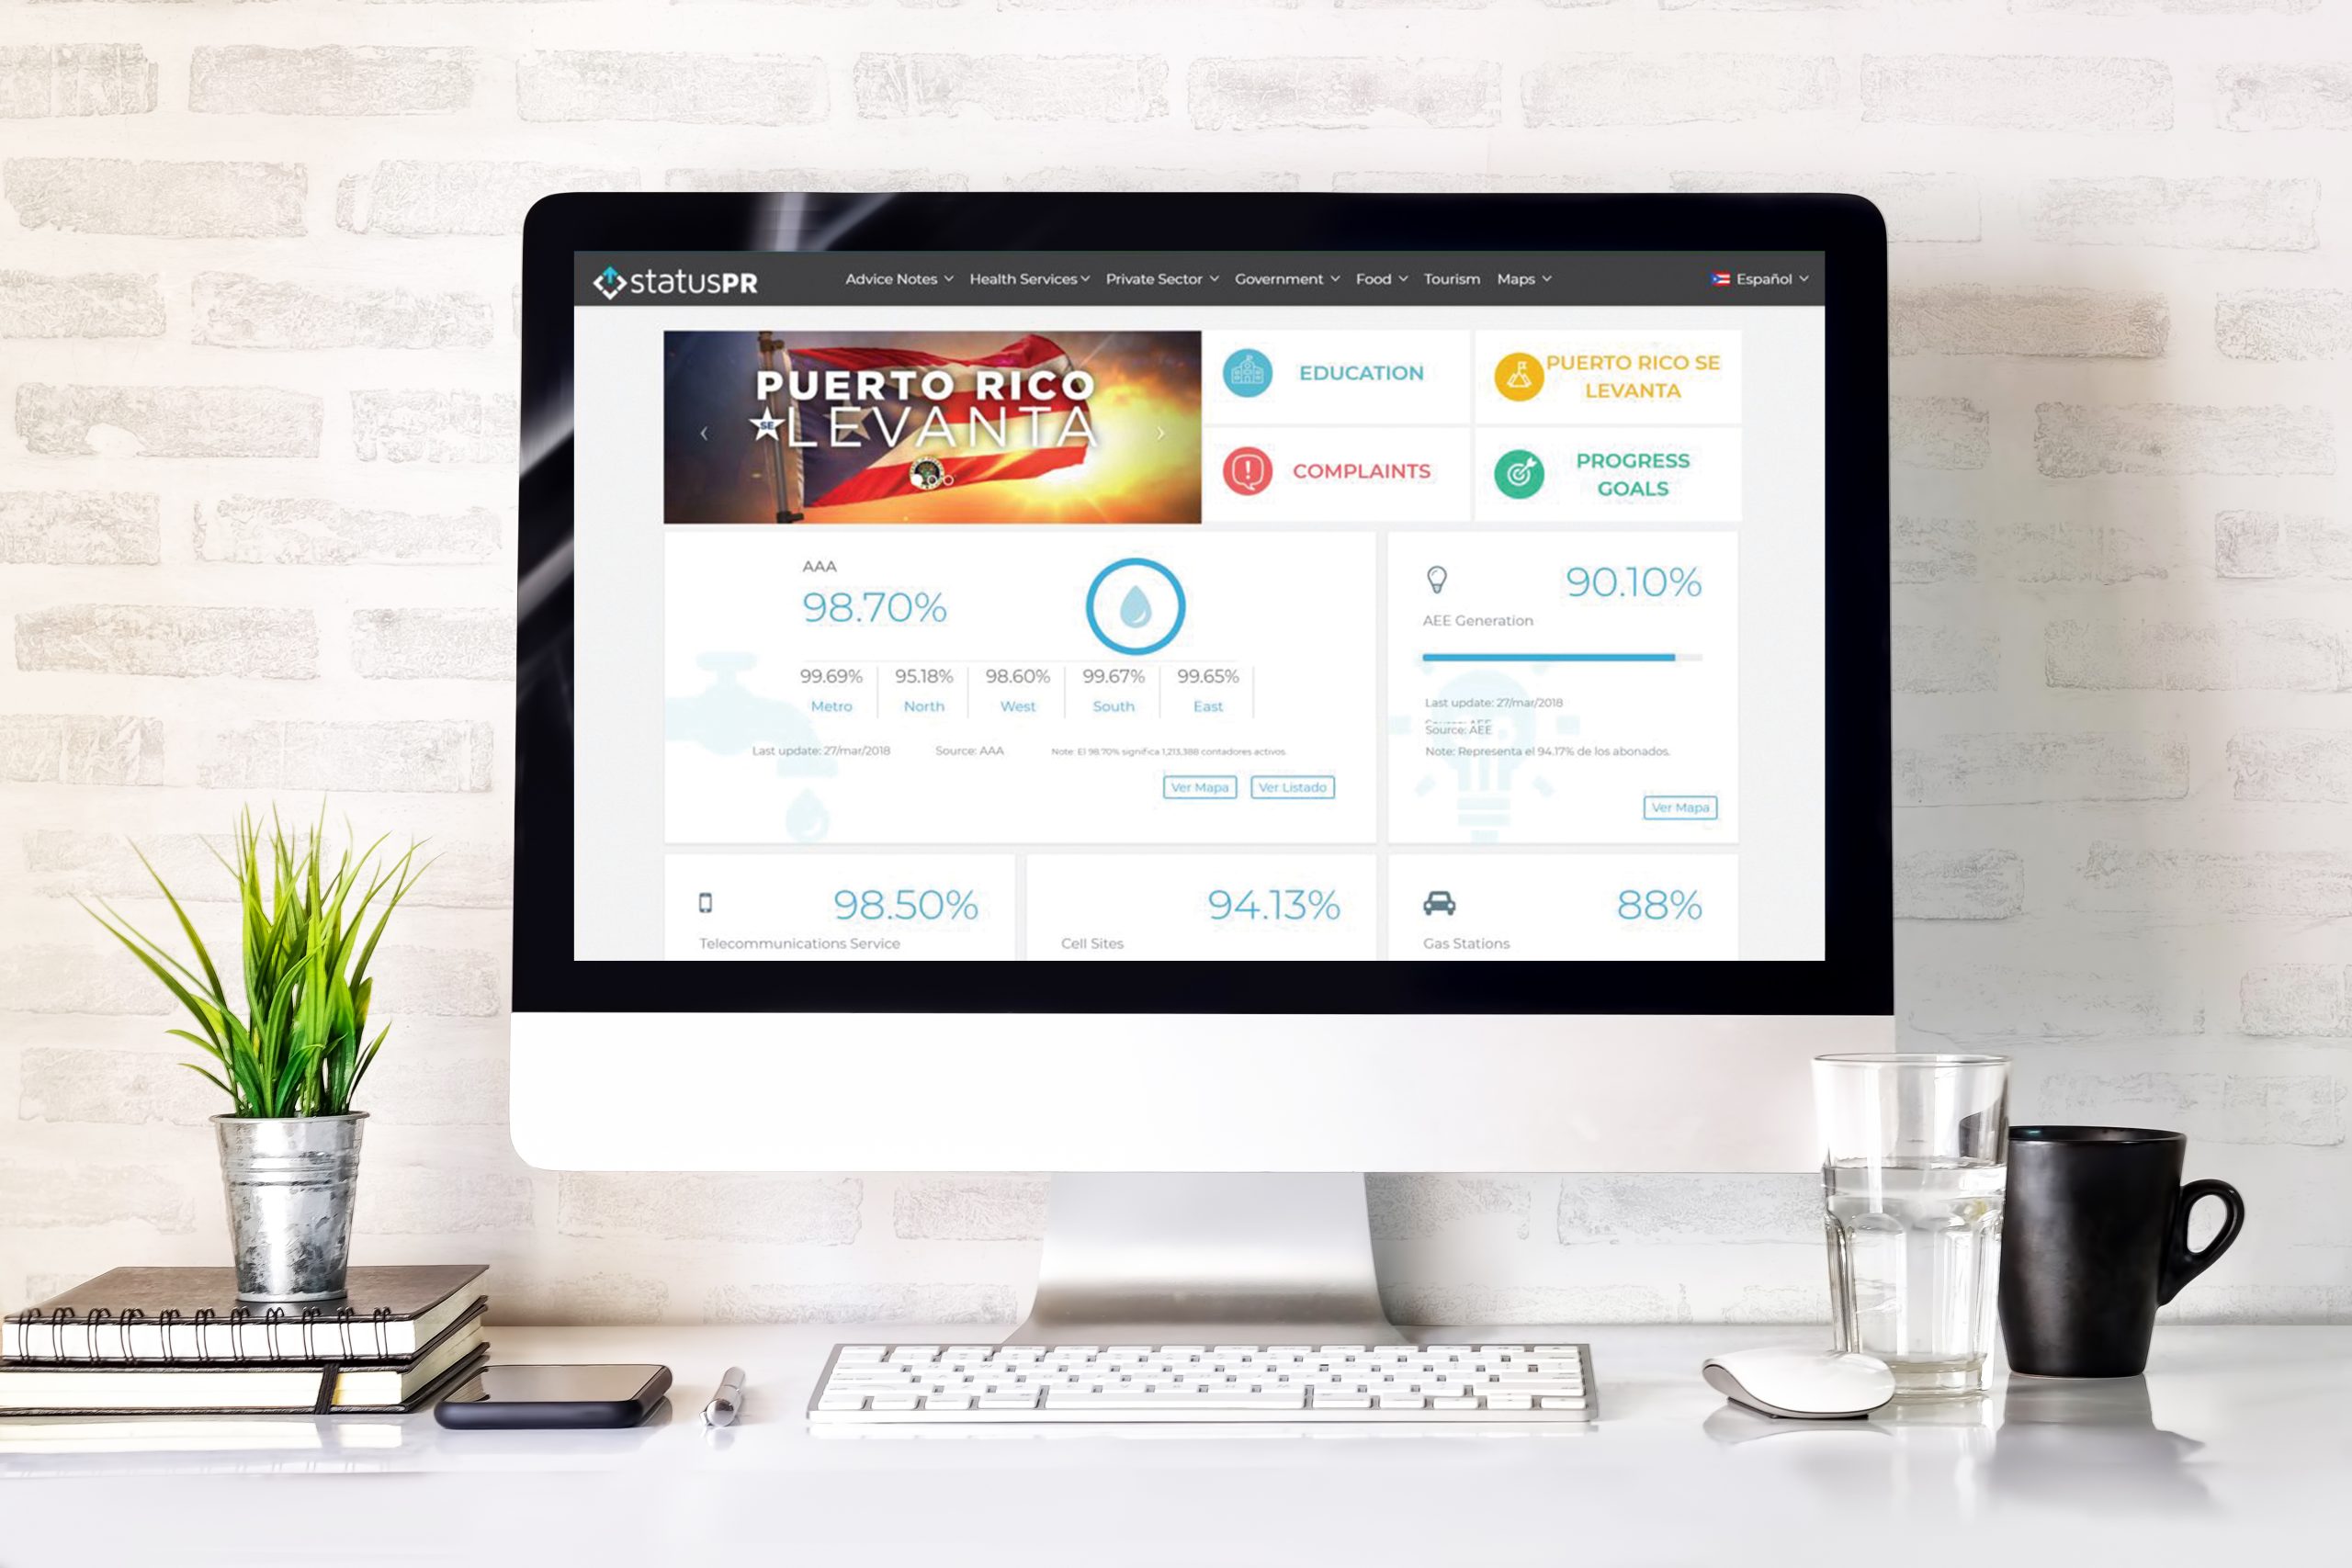
The popular app www.status.pr was created with Compass.
What Compass can do for your organization
Manage Complex Data
Leave spreadsheets behind.
Connect to multiple data sources.
Configure on cloud or on-premise.
Multiple data sources from a variety of departaments/entities.
Communicate Critical Information
Data consistency across the organization or multiple entities.
Easy-to-read insights for fast-paced decision making environments.
Peer collaboration in a cloud based data portal.
Used as a primary communication tool during disaster recovery efforts.
Mobile First World
Native HTML 5 with responsive design patterns.
On-the-go information, always available.
Easy-to-follow modern layout.
24/7 C-Level Executive and operational dashboards.
What is needed is a way to corral BI analytics and visualization engines, provide management with a way to control what information is broadcast, ensure they are operating off accurate data, and provide the means to take actions to correct problems rather than releasing everything automatically.
It is easy
with Compass
The benefits of working with Compass
Challenges
The data within an organization is growing exponentially. As such, communicating analyses in a timely manner has become a challenge and might result on revenue loss. Using a spreadsheet to interconnect all data sources is not enough anymore.
Ideal Solutions
We are moving in a fast-paced-world. Data generation and gathering is occurring almost instantly. As such, a powerful tool is essential to ease the decision making process. One that can manage, visualize, and communicate the data from all of your departments.
Desired Outcomes
Whether it’s an API, a spreadsheet, or a database, connect to your cloud or on-premises data and easily customize your visualization.
Results
Communicate results effectively, internally or to your stakeholders. • Own your data. • Facilitate data consistency and standardization throughout your organization
Drew Robb has been a full-time professional writer and editor for more than twenty years. He currently works freelance for a number of IT publications. He is also the editor-in-chief of an international engineering magazine. He has been published in Writer’s Digest, Forbes, Denver Post, The Economist, Computerworld, Information Week, HR Magazine, World Trade, Power Magazine, Turbomachinery International, The Writer, eSecurityPlanet, Small Business Computing, Wind Power Monthly, and countless others. He is the author of Server Disk Management for Windows Systems (CRC Press). As a freelancer, he is regularly hired by companies to write papers and articles. The list includes GE, Siemens, Microsoft, Dell, EMC, 3M, CA Technologies, IBM, Disney, Micron Technologies, Information Builders, Trend Micro, McAfee, Pennwell, Elsevier, DataCore, CommVault, KnowBe4, Condusiv, and many others. He has written and published thousands of magazine articles, papers, blogs, and newsletters.